Advertisement
Grab your lab coat. Let's get started
Welcome!
Welcome!
Create an account below to get 6 C&EN articles per month, receive newsletters and more - all free.
It seems this is your first time logging in online. Please enter the following information to continue.
As an ACS member you automatically get access to this site. All we need is few more details to create your reading experience.
Not you? Sign in with a different account.
Not you? Sign in with a different account.
ERROR 1
ERROR 1
ERROR 2
ERROR 2
ERROR 2
ERROR 2
ERROR 2
Password and Confirm password must match.
If you have an ACS member number, please enter it here so we can link this account to your membership. (optional)
ERROR 2
ACS values your privacy. By submitting your information, you are gaining access to C&EN and subscribing to our weekly newsletter. We use the information you provide to make your reading experience better, and we will never sell your data to third party members.
Environment
Academic R&D Spending Trends
Chemical research sector grew 3.6% in 2005, well below the overall 5.8% expansion for science and engineering
by Sophie L. Rovner
November 5, 2007
| A version of this story appeared in
Volume 85, Issue 45

Times are pretty good for scientists and engineers in academe???but not as good as they once were, according to data provided by the National Science Foundation. Granted, spending on science and engineering research and development by universities and colleges grew to $45.8 billion in fiscal 2005, the most recent year for which data are available from NSF. But the expansion was considerably smaller than during the heady years that began this decade.
Between 2000 and 2003, annual increases in academic R&D investment ranged from 9.1 to 10.9%. Growth eased to 7.9% in 2004. In 2005, it slipped to 5.8%, a rate slower than the prior decade's average annual increase of 7.5%.
Removing inflation from the statistics shows that total academic R&D spending rose a mere 2.7% in terms of constant dollars between 2004 and 2005. Between 1995 and 2005, total spending jumped 69.1% in terms of constant dollars, compared with 106.3% in current dollars.
Investment in basic research—which at $34.4 billion accounted for three-quarters of the total academic R&D budget—expanded 5.7% in terms of current dollars in 2005. By contrast, the average annual increase during the prior decade stood at 8.8%. Spending on applied R&D grew 6.1% to $11.4 billion in 2005, a rate considerably better than the 10-year annual average increase of 4.4% for the sector.
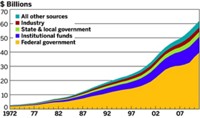
The federal government provides the lion's share of academic R&D money. In 2005, it shelled out 63.8% of the funds used in academe, close to its 2004 share. The $29.2 billion investment represented a 5.6% increase over the previous year. Institutions kicked in 18.1% of the total, followed by 6.4% from state and local governments and 5.0% from industry. These three sources' shares were also fairly close to their 2004 contributions.
Some 85.3% of total academic R&D spending was devoted to science in 2005. The $39.0 billion outlay represented a 5.7% increase over the prior year. The share invested in the life sciences inched up yet again, rising to 60.3% of total R&D spending in 2005. The sector's expansion slowed considerably from its typical heated pace, however, rising just 6.4% to $27.6 billion.
Funding for the physical sciences, which absorbed just 8.1% of the total R&D budget, grew a modest 4.5% to $3.7 billion in 2005. Outlays for chemistry couldn't even match that rate of growth, expanding just 3.6% to $1.4 billion, for a 3.0% share of the year's total R&D spending.
On a constant-dollar basis, chemistry spending rose a measly 0.5% from 2004 to 2005. Between 1995 and 2005, chemical R&D spending grew a total of 44.8% in constant dollars versus 76.7% in current dollars.
Spending of funds from all sources on engineering R&D grew 6.6% to $6.7 billion in 2005 in terms of current dollars, bringing the sector's share to 14.7% of total R&D spending. Materials engineering accounted for 1.3% of total spending and jumped 8.1% to $611 million that year. Chemical engineering didn't fare nearly as well, edging up just 2.0% to $503 million, for a 1.1% share of the total R&D budget.
Meanwhile, federal support for chemical engineering R&D surged 9.0% to $292 million in 2005, while it rose just 4.8% to $369 million for materials engineering. Federal investment in engineering as a whole rose 5.5% to $4.1 billion.
Science saw a hike of 5.6% to $25.1 billion in federal financing in 2005. Within the science sector, life sciences R&D saw a 6.2% increase in federal funding to $17.7 billion. Federal outlays for chemistry rose just 3.0% to $948 million. That anemic growth was quite a letdown after the prior year's 12.3% surge and was only about half the average annual increase of the prior decade.
Where did all this chemistry money go? Seven of the 10 institutions that spent most in 2004 did so again the following year. However, the University of California, San Diego; Texas A&M University; and Rutgers bumped Pennsylvania State University, Massachusetts Institute of Technology, and UC Los Angeles out of this top tier.
California Institute of Technology wrested the lead in 2005 from UC San Francisco, which had held first place for the previous three years. Caltech's $29.6 million spent on chemistry represented a 28.7% surge over its investment in 2004.
Harvard University improved to second place in 2005, with a 20.0% increase, bringing its chemical R&D investment to $26.6 million. With its 12.1% drop in spending to $26.0 million, UC San Francisco sank to third place in 2005. The University of Texas, Austin, took fourth place, and UC Berkeley rounded out the top five.
Altogether, the top 10 schools boosted their expenditures 9.3% to $242.8 million in 2005, slightly beating the 9.0% average annual increase of the previous decade.
The federal government bestowed its greatest support for chemical R&D on Caltech, providing the school with $25.2 million, a 27.9% jump over the 2004 contribution. Harvard received almost as much, while the next three schools—UC San Francisco, UC Berkeley, and UC San Diego—were allotted less than $20 million each.
Penn State headed the list in terms of 2005 spending on chemical engineering R&D, boosting its outlay by 23.6% to $17.4 million. North Carolina State University ranked second with $15.2 million in spending. UT Austin came in third, closely followed by Georgia Institute of Technology and MIT.
Arizona State University, Tempe, and Ohio State University were new to the top 10 list of spenders in 2005, displacing Prince??ton University and Purdue University.
Only one school—Penn State—received more than $10.0 million from the federal government for chemical engineering R&D in 2005. The university's $10.9 million in support represented a 24.2% increase over the prior year. Arizona State, Tempe, and Johns Hopkins University followed, receiving $9.9 million and $9.0 million, respectively. Georgia Tech and MIT rounded out the top five.
As a group, colleges and universities slimmed their spending on chemical research equipment by 4.2% to $111.6 million in 2005, the third annual decline in a row. The top 25 schools did their bit, however, hiking outlays by 22.5% to $40.9 million. Investments by individual institutions can swing dramatically from year to year. For instance, the University of Colorado's $3.6 million expenditure put it in first place in 2005, compared with 86th place the year before. Second-place UC San Diego shelled out $2.3 million in 2005, and third-place Louisiana State University spent $2.2 million. UC Berkeley and UC Irvine followed in fourth and fifth place.
Federal support for chemical research equipment rose 3.9% to $80.4 million in 2005. The government was particularly generous to the top 25 institutions, bestowing some $32.4 million in funding, for a 50.2% increase over 2004. The University of Colorado; UC San Diego; UC Berkeley; University of Puerto Rico, Rio Piedras; and Harvard received the largest federal grants for chemical research equipment.
The number of students seeking graduate degrees in chemistry in the U.S. rose yet again in 2005. The year's 1.7% increase brought the total to 21,122, more than 1,500 students higher than a decade earlier. The population of chemical engineering grad students slipped 3.7% to 7,173. Nearly half were foreign, as were more than one-third of the chemistry students.
Postdoctoral appointments declined in both disciplines in 2005. Chemical postdocs slipped 2.8% to 4,115, and chemical engineering postdocs eased 0.3% to 686.
Data for this article were drawn primarily from NSF's WebCASPAR database of academic science and engineering statistics, which can be reached online at caspar.nsf.gov. Further statistical information came from NSF's annual Academic Research & Development Expenditures report, which can be viewed at nsf.gov/sbe/srs/rdexp/start.htm.
Note that numbers from different tables may not match because of rounding.
Download Academic R&D Spending Trends (PDF size: 1.3 MB)
- This document has been saved as an Adobe Acrobat PDF file to retain the original formatting of the hard copy version. To view the document you will need Adobe Acrobat Reader.
- This file includes the following tables:
- FIELDS OF ACADEMIC R&D SPENDING
On average, annual growth in spending for chemistry has lagged behind that for life sciences since 1995 - FEDERALLY FINANCED R&D SPENDING AT UNIVERSITIES
Growth in chemistry spending in 2005 was only about half the average annual increase of the prior decade - SCHOOLS SPENDING MOST ON CHEMICAL R&D
Growth in 2005 among top 50 schools fell below average annual growth of the prior decade - SCHOOLS WITH MOST FEDERAL SUPPORT FOR CHEMICAL R&D
Top 10 schools' growth in 2005 funding was nearly double that of the top 50 - TOP 25 UNIVERSITIES IN 2004 R&D SPENDING
Top schools invested only 2.5% of their R&D funds in chemistry - CHARACTER OF ACADEMIC R&D SPENDING
Spending on basic research has shown impressive growth over the past decade - FEDERAL SUPPORT FOR CHEMICAL ENGINEERING R&D
Arizona State's Tempe campus led growth in the top 25 in 2005 - FEDERAL SUPPORT FOR CHEMICAL RESEARCH EQUIPMENT
Growth at the top 25 surged by 50% in 2005, well ahead of total growth at all institutions - SOURCES OF ACADEMIC R&D FUNDS
Federal share remained at 64% in 2005 - TOP 25 UNIVERSITIES IN 2004 R&D SPENDING
Accounted for 30% of spending in chemistry and 37% of spending in physical sciences - SCHOOLS SPENDING MOST ON CHEMICAL RESEARCH EQUIPMENT
Total spending dropped again in 2005, although a few schools saw tremendous increases - UNIVERSITY SPENDING FOR RESEARCH EQUIPMENT
Outlays for chemistry equipment declined for the third year in a row in 2005 - SCHOOLS SPENDING MOST ON CHEMICAL ENGINEERING R&D
Growth at the top 25 outpaced growth at all institutions by a wide margin in 2005 - FOREIGN GRADUATE STUDENTS
More than one-third of chemistry and nearly half of chemical engineering grad students were from outside the U.S. in 2005 - SCIENCE GRADUATE STUDENTS
Rise in number studying chemistry in 2005 continued the recent trend of slow but steady annual increases - POSTDOCTORAL POSITIONS
After several years of increases, number of chemistry postdocs slipped slightly in 2005


Join the conversation
Contact the reporter
Submit a Letter to the Editor for publication
Engage with us on Twitter