Advertisement
Grab your lab coat. Let's get started
Welcome!
Welcome!
Create an account below to get 6 C&EN articles per month, receive newsletters and more - all free.
It seems this is your first time logging in online. Please enter the following information to continue.
As an ACS member you automatically get access to this site. All we need is few more details to create your reading experience.
Not you? Sign in with a different account.
Not you? Sign in with a different account.
ERROR 1
ERROR 1
ERROR 2
ERROR 2
ERROR 2
ERROR 2
ERROR 2
Password and Confirm password must match.
If you have an ACS member number, please enter it here so we can link this account to your membership. (optional)
ERROR 2
ACS values your privacy. By submitting your information, you are gaining access to C&EN and subscribing to our weekly newsletter. We use the information you provide to make your reading experience better, and we will never sell your data to third party members.
Policy
Academic R&D Spending Trends
Spending on chemical research and on science and engineering as a whole rose a moderate 4.3% in 2006
by Sophie L. Rovner
November 3, 2008
| A version of this story appeared in
Volume 86, Issue 44
ENTHUSIASM FOR INVESTMENT in research and development in academe appears to be waning. Funding continued to expand in fiscal 2006, the most recent year for which data are available from the National Science Foundation, but the outlook is troubling, particularly in light of the current economic climate.

Overall university and college spending on science and engineering R&D rose just 4.3% to $47.8 billion in 2006. That year marked the fourth in a row in which spending rose less than the prior year. Average annual growth from 1996 to 2006 was 7.6%, but that strong performance owed a lot to the 9.1 to 10.9% annual increases that occurred in the first four years of the current decade. Growth slipped to 7.9% in 2004 and 5.9% the following year. The 2006 expansion was the smallest since 1996.
Removing inflation from the statistics shows that total R&D spending by universities and colleges edged up 1.0% in terms of constant dollars between 2005 and 2006. From 1996 to 2006, spending grew a total of 67.2% in constant dollars, compared with 107.2% in current dollars.
For many years, basic research has soaked up three-fourths of the total outlay on academic R&D. In 2006, $36.0 billion was funneled into basic research, a rise of 4.9% in current dollars versus 2005. That growth pales beside the robust 8.8% annual average increase during the prior decade. Applied R&D spending rose a mere 2.5% to $11.7 billion in 2006, well off the 10-year annual average increase of 4.5%.
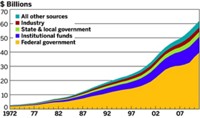
Much of academe's total R&D budget is supplied by the federal government. In 2006, the federal sector's $30.0 billion outlay—which represented an increase of 2.9% over the prior year—accounted for 62.9% of total funding. Institutions provided just 19.0% of the total, followed by state and local governments, with a 6.3% stake, and industry, with a 5.1% share.
Each year, science absorbs far more academic R&D dollars than does engineering, and 2006 was no different, with 85.2% of the budget directed to science. The $40.7 billion investment in science was 4.2% higher than in 2005. The largest sector by far continued to be the life sciences, accounting for 60.4% of the total academic R&D budget. Spending on the sector rose 4.4% to $28.8 billion in 2006.
The physical sciences, among them chemistry, physics, and astronomy, were allotted just 8.0% of total R&D funding in 2006. Academe invested $3.8 billion in this category, an increase of 3.2% over 2005. Investment in chemistry rose 4.3% to $1.4 billion in 2006. That growth maintained chemistry's share at 3.0% of the total R&D budget.
On a constant-dollar basis, chemistry spending rose a mere 1.0% between 2005 and 2006. From 1996 to 2006, chemical R&D spending grew a total of 43.3% in constant dollars, compared with 77.6% in current dollars.
From 2005 to 2006, engineering spending grew at a faster rate than science spending, rising 5.0% in current dollars to reach $7.1 billion. Engineering's 14.8% portion of the total budget was a smidgeon higher than the prior year's share.
Materials engineering spending, which accounted for 1.3% of the total R&D budget in 2006, grew 5.2% compared with the previous year to reach $644 million. Chemical engineering beat that growth rate, rising a healthy 8.1% to $547 million, for a 1.1% share of the total budget.
FEDERAL SUPPORT for chemical engineering rose more than usual. Between 2005 and 2006, investment in the sector expanded 6.1% to $313 million. Federally financed materials engineering spending grew 4.9% to $387 million. Federal investment in engineering as a whole rose only 2.7% to $4.2 billion in 2006.
Federal support for science R&D in academe increased just 2.9% to $25.8 billion between 2005 and 2006. Within the science sector, the life sciences gained 3.2% in funding to reach $18.3 billion in 2006. Chemistry's pickings were slim, with federal R&D backing edging up just 2.6% to $974 million.
For the second year in a row, California Institute of Technology spent more than any other school on chemical R&D. Its investment shot up 16.1% to $34.3 million in 2006. Harvard University's outlay surged 27.7% to $33.9 million, maintaining its second-place rank for a second consecutive year.
The University of California, Berkeley, climbed from fifth to third place by hiking its spending to $27.3 million in 2006. UC San Francisco slipped down one spot to take fourth as its expenditure shrank to $25.7 million. Meanwhile, the University of Illinois, Urbana-Champaign, moved from seventh to fifth with a $25.0 million outlay. The University of Texas, Austin; Rutgers, State University of New Jersey; Georgia Institute of Technology; Pennsylvania State University; and Texas A&M University rounded out the list of the 10 biggest spenders. Georgia Tech and Penn State were the only newcomers in this top tier in 2006; they displaced UC San Diego and Cornell University.
Harvard benefited from the largest federal allocation for chemical R&D in 2006. Its $31.7 million allotment marked a 31.4% surge over its share in the previous year. Second-place Caltech pulled in $28.7 million. The federal government provided less than $20 million each to the next three schools, UC San Francisco, UC Berkeley, and Rutgers.
An outlay of $18.9 million boosted Massachusetts Institute of Technology into first place in terms of chemical engineering R&D spending in 2006. The school's investment was 37.2% higher compared with spending in 2005. North Carolina State University placed second, with $16.5 million in spending. Penn State, Georgia Tech, and UT Austin rounded out the top five.
MIT also topped the list of schools with the most federal support for chemical engineering R&D in 2006. The government's $13.2 million contribution to MIT dwarfed the $8.9 million given to second-place Arizona State University, Tempe. The other top five schools—Penn State, Johns Hopkins, and the University of Michigan—received slightly less than Arizona State.
After three years of declines, school spending on chemical research equipment rebounded in 2006. Universities and colleges poured $120.7 million into these assets, some 7.8% more than in 2005. Meanwhile, the top 25 schools spent a whopping 57.0% more than they did in the prior year, bringing their 2006 total to $50.9 million.
Indiana University's $5.1 million outlay put it in first place on the 2006 list. The University of Colorado came in second, with a $3.8 million investment, followed by UC San Diego, with $3.6 million in spending. Harvard and Rutgers placed fourth and fifth, respectively.
Total federal support for chemical research equipment slipped modestly in 2006. The government provided universities and colleges with $79.3 million, or 1.4% less than in 2005. Almost half went to the top 25 schools, which collected $35.8 million. The largest federal grants went to the University of Colorado, UC San Diego, Harvard, UC San Francisco, and Rutgers.
THE NUMBER of students seeking graduate degrees in chemistry continued a long-term growth trend in 2006. The year's 1.2% rise brought the total to 21,351. The population of chemical engineering grad students rose the same percentage, to 7,261 in 2006. As is usual, about half the chemical engineering students were foreign, whereas more than one-third of the chemists were from outside the U.S.
The number of postdoctoral appointments for chemists shrank for the second year in a row, slipping 4.1% to 4,044. Chemical engineering postdocs fared better: Their numbers rose 2.8% to 722 in 2006.
Data for this article were drawn primarily from NSF's WebCASPAR database of academic science and engineering statistics, which can be accessed online at caspar.nsf.gov. Further information came from NSF's annual Academic Research & Development Expenditures Report, which can be viewed at www.nsf.gov/statistics/nsf08300.
Note that numbers from different tables may not match because of rounding.
- » Download Academic R&D Spending Trends
- (C&EN, pp. 31-35, 320 KB)
 This document has been saved as an Adobe Acrobat PDF file to retain the original formatting of the hard copy version. To view the documents you will need Adobe Acrobat Reader. Download a free copy now or obtain further information about Adobe Acrobat Reader.


Join the conversation
Contact the reporter
Submit a Letter to the Editor for publication
Engage with us on Twitter