Advertisement
Grab your lab coat. Let's get started
Welcome!
Welcome!
Create an account below to get 6 C&EN articles per month, receive newsletters and more - all free.
It seems this is your first time logging in online. Please enter the following information to continue.
As an ACS member you automatically get access to this site. All we need is few more details to create your reading experience.
Not you? Sign in with a different account.
Not you? Sign in with a different account.
ERROR 1
ERROR 1
ERROR 2
ERROR 2
ERROR 2
ERROR 2
ERROR 2
Password and Confirm password must match.
If you have an ACS member number, please enter it here so we can link this account to your membership. (optional)
ERROR 2
ACS values your privacy. By submitting your information, you are gaining access to C&EN and subscribing to our weekly newsletter. We use the information you provide to make your reading experience better, and we will never sell your data to third party members.
Business
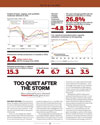
Too Quiet After The Storm
After a rebound in 2010, chemical production hardly grew in 2011
by Business Department
July 2, 2012
| A version of this story appeared in
Volume 90, Issue 27
For most sectors of the chemical industry, the largest chunk of postrecession recovery in chemical production occurred in 2010. In 2011, there was a broad leveling off—and in some cases a reversal—in the amount of chemicals made in many parts of the world.
COVER STORY
Too Quiet After The Storm
In the U.S., for example, the Federal Reserve Board reports that the production index for chemicals grew only 0.4% in 2011; in 2010 the increase was 3.5%. Chemical production figures for 2011 resemble ones from 2003 more closely than those from the prerecession boom year of 2007. The largest increases were in soaps and toiletries and synthetic dyes and pigments. The basic chemicals and organic chemicals indexes both decreased from 2010.
The strong production performance in 2010 improved plant capacity utilization, which had hit a low point of 64.7% in 2008. Despite anemic production, that push continued into 2011, when chemical manufacturers achieved 78.8% utilization—close to the high-water mark of 79.0% achieved in 2006. Running plants at high capacity lowers costs per unit of output, improves profit margins, and emboldens firms to raise prices.
Missing from C&EN’s collection of production data this year are the U.S. inorganic and organic chemical output tables. Unlike the indexes tabulated by the Federal Reserve Board, these tables provided absolute production numbers for most of the important industrial chemicals.
Download this article complete with online only tables here.
The data for the inorganics table came from the U.S. Census Bureau’s now discontinued Current Industrial Report program. According to a notice on the Census Bureau’s website, the bureau “concluded it necessary to terminate and reduce some existing programs in order to secure funding for new programs and manage cyclical increases for other data collection programs.”
The National Petrochemical & Refiners Association, now the American Fuel & Petrochemical Manufacturers, historically supplied information on high-volume organic chemicals such as benzene, ethylene, ethylene dichloride, and propylene for the U.S. organics production table. But that information is no longer distributed to the media.
However, statistics for U.S. plastics production continue to be available from the American Plastics Council. Polystyrene output jumped 8.2% from 2010 to 2011, likely because the trade association began including Mexican facilities. Otherwise, the highest growth rate, at 3.0%, was for polyvinyl chloride and copolymers. Output of high-density polyethylene nudged up by 1.4%. In contrast, low-density and linear low-density polyethylene production shrank, as did polypropylene output.
Another modification for this year’s edition of Facts & Figures is in European production. C&EN has stopped publishing production figures for all of Europe and instead presents only German production.
In past years, C&EN obtained European production figures for most products from the European Commission. Other sources were the Association of Petrochemical Producers in Europe and Euro Chlor. Now C&EN acquires only German production data from Statistisches Bundesamt, the Federal Statistical Office of Germany.
The primary reason for the switch is timeliness. Eurostat, the EC’s database, releases prior-year data too late for the Facts & Figures issue, whereas German data for 2011 are available. Because Germany is by far the largest chemical producer in Europe, it is an adequate proxy for the continent overall.
The data are also more consistent over the 11 years presented in Facts & Figures. The countries included in European data sets changed over time, and only data from 2005 onward include all 27 countries currently in the European Union. The German data, in contrast, allow a meaningful measurement of compound annual growth rates.
Over the past two years, as concerns about sovereign debt in Europe have grown, Germany has increasingly been a diamond in the European rough. Although overall production results for Germany in 2011 were mixed, on balance they have strengthened rather than weakened.
German production of some major products, such as ethylene and propylene, rose by less than 1% last year. Production of vinyl chloride, used to make polyvinyl chloride, was down 17.7%. Styrene, a raw material for polystyrene and other polymers, however, saw a strong increase of 9.2%.
German output of inorganic chemicals was uneven last year. Output of chlorine dropped by 4.1%, and its coproduct sodium hydroxide declined by more than 9%. Sulfuric acid production increased 4.7%.
German polymer production showed positive trends in 2011. Output of commodity polymers such as polyethylene, polystyrene, and polyurethanes rose modestly. Curiously, polyvinyl chloride production jumped 10.5% despite the decline in vinyl chloride output. German fertilizer production was weak, with urea output declining by close to 40%.
In Asia, South Korea’s chemical output increased by 3.0% in 2011, whereas indexes of production in Japan and Taiwan were lower than in 2010. Companies in Japan had to cope with a massive earthquake and tsunami, power shortages, and a record-high currency through much of the year. Meanwhile, chemical makers in Taiwan suffered from a series of industrial accidents that derailed production.
The negative signs abound in the yearly change column for a variety of chemicals made in Japan and Taiwan. Exceptions were acrylonitrile output in Japan and terephthalic acid production in Taiwan. Meanwhile, South Korea’s manufacture of benzene, butadiene, and ethylene continued their decadelong increase, although increases in 2011 were smaller than average.
Output of the inorganic chemicals ammonia and titanium dioxide increased faster than average in Japan, while most other categories shrank, and by a faster rate than average.
South Korea’s output of plastics was mixed. The country posted a 5.0% increase in low-density polyethylene production, but output of other plastics dropped. Fitting the trend for 2011, Japan and Taiwan saw rather significant decreases in plastics manufacture across the board. For example, polypropylene output in Taiwan sank by more than 11%, though in most previous years it increased.
Data sleuths looking for large numbers can peruse the output from China’s basic chemicals industry. Production of methanol soared 41.5%, and benzene was up more than 20%. In inorganics, sodium hydroxide production jumped 18.2%. But output of the key manufacturing input ethylene increased by only 7.7%, down from its typical 12.3% growth rate.
In Canada, 2011 was a good year for fertilizer production, likely because of high agriculture commodity prices. Ammonium nitrate output grew 16.7%, and ammonia bumped up 7.5%. Both figures vastly exceed decadelong average growth rates. In plastics, Canada continued to roll back production of polyesters, but it did manage a 1.4% increase in polyethylene output last year.
Chemical & Engineering News
ISSN 0009-2347
Copyright © 2024 American Chemical Society
The power is now in your (nitrile gloved) hands
Sign up for a free account to get more articles. Or choose the ACS option that’s right for you.
Already have an ACS ID? Log in
Join the conversation
Contact the reporter
Submit a Letter to the Editor for publication
Engage with us on Twitter