Advertisement
Grab your lab coat. Let's get started
Welcome!
Welcome!
Create an account below to get 6 C&EN articles per month, receive newsletters and more - all free.
It seems this is your first time logging in online. Please enter the following information to continue.
As an ACS member you automatically get access to this site. All we need is few more details to create your reading experience.
Not you? Sign in with a different account.
Not you? Sign in with a different account.
ERROR 1
ERROR 1
ERROR 2
ERROR 2
ERROR 2
ERROR 2
ERROR 2
Password and Confirm password must match.
If you have an ACS member number, please enter it here so we can link this account to your membership. (optional)
ERROR 2
ACS values your privacy. By submitting your information, you are gaining access to C&EN and subscribing to our weekly newsletter. We use the information you provide to make your reading experience better, and we will never sell your data to third party members.
Policy
2011 Academic R&D Spending Trends
NSF census, two years into a revamp, has more details about chemistry department funding sources
by Carmen Drahl
December 9, 2013
| A version of this story appeared in
Volume 91, Issue 49
Click here to download a PDF of this article.
Head here to check out our interactive table comparing the top 100 chemistry spenders in 2011.
“Follow the money” is a popular saying for a reason. For researchers and administrators, trends in academic research funding can tell many stories. They can be a harbinger of a department on the rise, or they may point out a rival university’s investment priorities.
Every year, the National Science Foundation updates its comprehensive census of academic R&D spending. These data are an indicator of a university’s research capacity and can be a factor in faculty and graduate student recruitment. This year, NSF made available data from fiscal 2011. It is the second census to reflect a major revision of the survey by the agency.
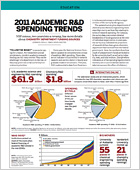
The updated survey gives departments of chemistry and chemical engineering more ways than ever to see how they stack up in terms of research spending. For instance, the survey data now contain detailed breakdowns of funding sources at the level of individual departments. In years past, the survey only indicated the proportion of research dollars that a given chemistry department had received from the federal government. Now, the numbers show how much of a department’s funds are kicked in by the university itself, as well as by industry, state, and local sources. (Except where indicated, all of the spending figures cited in this story are in current dollars and do not take into account the effect of inflation.)
The lion’s share of academic R&D funds goes to the life sciences, and so it follows that the top-spending universities in academic R&D overall are big life sciences spenders. None of the top five chemistry spenders made the top 25 universities in research spending overall.
The data make clear just how much sources of funding vary at universities that have invested the most in chemistry R&D. The data also illustrate that despite vast changes in the scientific landscape over the past decade, the various scientific disciplines still receive essentially identical pieces of the overall academic spending pie.


In chemistry, there are overall top-dog schools. In fiscal 2011, Rutgers University spent the most money for chemistry R&D from all sources combined. The top chemical engineering research spender in 2011 was the University of Texas, Austin.
Universities fund science and engineering R&D through a variety of sources, such as the federal government; industry, state and local government; and institutional funds. A given department’s percentage of institutional R&D funds, however, can vary from the single digits to more than 50%. The top 10 spenders on chemistry R&D had, on average, a lower percentage of institutional funds, 10.4%, than the overall average of 18.7%.

Most chemistry departments received small percentages of their funds from industry sources. Among all institutions, the average was 3.6%. Standouts included Georgia Tech, Indiana University, Virginia Tech, and the University of Southern California, all of which received more than 10% of their chemistry funds from industry. The industry figure is higher in departments of chemical engineering, where all institutions averaged 13.6% of spending funded by business.
Data for this article were drawn primarily from NSF’s WebCASPAR database of academic science and engineering statistics, which can be accessed online at webcaspar.nsf.gov. Further information came from NSF’s Higher Education Research & Development Survey, which can be viewed at nsf.gov/statistics/nsf13325.
Interactive Table: Follow The Money
If you are having trouble viewing any tables, click here for a PDF of the article.


Join the conversation
Contact the reporter
Submit a Letter to the Editor for publication
Engage with us on Twitter