Advertisement
Grab your lab coat. Let's get started
Welcome!
Welcome!
Create an account below to get 6 C&EN articles per month, receive newsletters and more - all free.
It seems this is your first time logging in online. Please enter the following information to continue.
As an ACS member you automatically get access to this site. All we need is few more details to create your reading experience.
Not you? Sign in with a different account.
Not you? Sign in with a different account.
ERROR 1
ERROR 1
ERROR 2
ERROR 2
ERROR 2
ERROR 2
ERROR 2
Password and Confirm password must match.
If you have an ACS member number, please enter it here so we can link this account to your membership. (optional)
ERROR 2
ACS values your privacy. By submitting your information, you are gaining access to C&EN and subscribing to our weekly newsletter. We use the information you provide to make your reading experience better, and we will never sell your data to third party members.
Policy
Bad Moon Rising For U.S. Workforce
Employment is down for five months in a row, but chemists, other graduates are doing a little better
by Michael Heylin
June 16, 2008
| A version of this story appeared in
Volume 86, Issue 24
THE SHAKINESS of the U.S. economy was brought jarringly to consciousness this month with data from the Bureau of Labor Statistics. They indicate that the unemployment rate for the month of May climbed from 5.0% to 5.5%—an unprecedented one-month increase of 861,000 people in the ranks of the unemployed.
The data also reveal that the number of workers on nonfarm payrolls in May, 137.8 million, was more than 300,000 lower that it had been at the end of last year, when this most credible measure of employment peaked.
This latest peak-to-peak job cycle, from the high of February 2001, to the high of December 2007, lasted 82 months and produced a payroll increase of 4%, or 5.5 million jobs. It was the weakest such peak-to-peak gain since the 1950s.
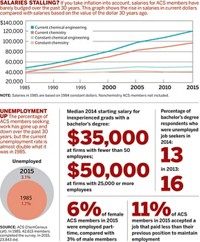
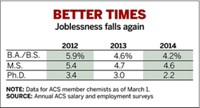
The impact of the job-market weakness on chemists is not yet clear. The latest American Chemical Society salary and employment surveys of its members in the domestic workforce and of new chemistry graduates are based on data gathered in March and October 2007, respectively, before the recent sharp employment deterioration (C&EN, March 3, page 37, and June 2, page 52).
A positive factor for chemists is that only a few of them are in the 16- to 24-year age bracket, which always has a high unemployment rate—13.0% in May. Another is that chemists are college graduates, who traditionally have the lowest unemployment rates—2.2% in May compared with 8.3% for those without a high school diploma. However it is spun, the overall job outlook is not good. If history repeats itself, more months of employment decline are inevitable.
Since 1948, there have been nine peak-to-peak job cycles. They average an initial 15 months of employment decline followed by 64 months of employment growth.
The U.S. job market has struggled since its peak in early 2001. The decline phase lasted 30 months, twice the average. By the end of this year, there may be about 5 million more people on nonfarm payrolls than there were in 2000. This compares with a 23 million-person gain over the 1992-to-2000 time span.
The weakening of the job market is pervasive. Health care is the only major employment sector to have added more jobs in 2000–08 (2.9 million) than were added in 1992–00 (2.5 million). The number of goods-producing jobs went from a 3.5 million gain in 1992–00 to a loss of 4.0 million in 2000–08. Growth in service-providing jobs fell from 20.6 million to 8.3 million.
During each of the past two eight-year periods, the population of people between 16 and 64 years of age in the U.S. has grown by close to 16.5 million. In the first period, 1992–00, total employment rose by almost 19 million. But since 2000, total employment has risen by only 8 million.


Join the conversation
Contact the reporter
Submit a Letter to the Editor for publication
Engage with us on Twitter