Advertisement
Grab your lab coat. Let's get started
Welcome!
Welcome!
Create an account below to get 6 C&EN articles per month, receive newsletters and more - all free.
It seems this is your first time logging in online. Please enter the following information to continue.
As an ACS member you automatically get access to this site. All we need is few more details to create your reading experience.
Not you? Sign in with a different account.
Not you? Sign in with a different account.
ERROR 1
ERROR 1
ERROR 2
ERROR 2
ERROR 2
ERROR 2
ERROR 2
Password and Confirm password must match.
If you have an ACS member number, please enter it here so we can link this account to your membership. (optional)
ERROR 2
ACS values your privacy. By submitting your information, you are gaining access to C&EN and subscribing to our weekly newsletter. We use the information you provide to make your reading experience better, and we will never sell your data to third party members.
Analytical Chemistry
Optical Method Measures Graphene Quality
Materials: A technique uses polarized light to characterize the quality and thickness of graphene quickly and efficiently
by Neil Savage
July 30, 2014

Graphene’s remarkable electrical and optical properties might lead to a new generation of computer chips, photovoltaic cells, and other devices. To make such devices practical, however, graphene has to be produced at an industrial scale, which means manufacturers need rapid ways to monitor the quality of their material. Now scientists in Taiwan have shown that a method long used for measuring the thickness of thin films provides information about the quality of graphene more quickly than current methods (Anal. Chem. 2014, DOI: 10.1021/ac501557c).

Researchers typically use Raman spectroscopy to check the structural quality and thickness of graphene, but because the technique can only cover a small area in a given time, it’s painfully slow. It also works only on specially designed substrates. So materials scientist Hsuen-Li Chen of National Taiwan University and colleagues turned to spectroscopic ellipsometry, an optical technique widely used in the semiconductor industry to characterize thin films at a resolution below 1 nm. In ellipsometry, researchers shine a beam of light through a film, and the substrate holding the film reflects it back. Defects in the film change the polarization of the reflected light, thus providing information about the quality of the film. Previously, researchers had not considered how the quality of graphene could affect the polarization, Chen says, but his team thought that ellipsometry might prove to be a useful technique for evaluating the material.
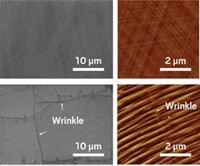
The team grew layers of graphene through chemical vapor deposition and then transferred the films to a variety of substrates, including copper, fused silica, and silicon, to show that the technique could work on any of those materials. They grew graphene films of different qualities by varying the temperature they used during deposition from 800 to 950 °C. On the basis of mathematical models, the team expected that more defects would lead to greater changes in the polarization of the reflected light. Their experiments confirmed those results.
The method also allows researchers to measure the thickness of the graphene layers simply: The thicker the film, the more the reflected light was shifted toward the red end of the spectrum. Because the technique allows researchers to measure both quality and thickness simultaneously, ellipsometry translates to higher throughput in a production setting, Chen says. This technique is also much faster than Raman spectroscopy. Ellipsometry can map a 1-cm2 sheet of graphene in under a minute, he says. Raman would take more than an hour.
The method is “a significant step toward large-scale characterization,” says James M. Tour, a synthetic organic chemist and materials scientist at Rice University. He’d like to see how well ellipsometry works on graphene films with multiple layers stacked in different configurations. “Overall, however, it looks like a great complement to the techniques used to characterize graphene,” Tour says.


Join the conversation
Contact the reporter
Submit a Letter to the Editor for publication
Engage with us on Twitter