Advertisement
Grab your lab coat. Let's get started
Welcome!
Welcome!
Create an account below to get 6 C&EN articles per month, receive newsletters and more - all free.
It seems this is your first time logging in online. Please enter the following information to continue.
As an ACS member you automatically get access to this site. All we need is few more details to create your reading experience.
Not you? Sign in with a different account.
Not you? Sign in with a different account.
ERROR 1
ERROR 1
ERROR 2
ERROR 2
ERROR 2
ERROR 2
ERROR 2
Password and Confirm password must match.
If you have an ACS member number, please enter it here so we can link this account to your membership. (optional)
ERROR 2
ACS values your privacy. By submitting your information, you are gaining access to C&EN and subscribing to our weekly newsletter. We use the information you provide to make your reading experience better, and we will never sell your data to third party members.
Mass Spectrometry
The emerging world of single-molecule mass measurements
New methods characterize large and complex samples that conventional mass spec struggles with
by Celia Henry Arnaud, special to C&EN
June 4, 2023
| A version of this story appeared in
Volume 101, Issue 18

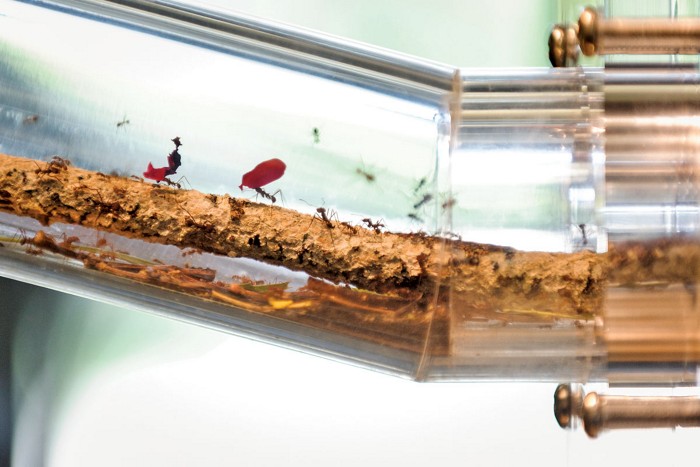
Credit: Gwendolyn Jarrold | A disassembled charge detection mass spectrometry ion trap
In brief
For large molecules and complex mixtures, conventional mass spectra can become too complicated to interpret. New technologies including various forms of charge-detection mass spectrometry, mass photometry, and nanoelectromechanical systems are allowing researchers to ditch the complexity and measure the mass of individual molecules, complexes, and particles. Read on to learn how these technologies work and how researchers are using them.
At the University of Oxford, Justin Benesch studies assemblies made between proteins called molecular chaperones and the proteins they protect in cells. These assemblies slow the formation of amyloid fibers, elongated protein structures that are a major component of cataracts and are associated with neurodegenerative diseases. Such protein complexes and fibers exist not in single oligomeric states but as complex mixtures.
As a mass spectrometrist studying biological systems, Benesch has long relied on native mass spectrometry—an approach that lets him look at proteins and protein complexes in their native, rather than denatured, unfolded forms. But native MS can fall short.
“As you look at more complex species, you start to realize that native mass spectra can, in some circumstances, become essentially uninterpretable,” Benesch says. “The data are there, but the information can’t be extracted in a meaningful way.”
The problem, Benesch notes, is that everything in a mass spectrum is on a mass-to-charge ratio (m/z) axis; any given value of m can have multiple values of z. Peaks become entangled and overlap.
But what if there were methods that allowed researchers to look at mass by itself rather than m/z?
Such methods have become available in recent years. In fact, researchers now have several options for determining the mass of individual molecules. Two of these methods are versions of mass spectrometry in which the charge (z) is detected separately from m/z, hence the name charge detection MS (CDMS). Multiplying m/z by z allows the mass to be calculated. The other approaches are optical and nanoelectromechanical methods.
The optical microscopy technique known as mass photometry determines mass from changes in reflectivity at an interface. In nanoelectromechanical systems MS (NEMS-MS), the resonant vibrational frequencies of tiny silicon-based devices change in response to mass.
Some of these instruments are already commercially available; others are in development. Researchers are using the methods to answer a key question in gene therapy and better study large biomolecules and complexes.
Multiple flavors of CDMS
There are multiple types of CDMS. In CDMS based on linear ion traps, a few ions at a time enter a metal tube that’s fitted with electrodes at both ends. As the ions shuttle back and forth between the electrodes, they induce a charge on the tube that an amplifier detects. The ions’ oscillation frequency is used to determine their m/z via a common computer-driven mathematical procedure known as Fourier transform data analysis.
The charge is calculated from the amplitude of the Fourier transform signal and can be measured accurately enough to correctly assign the charge state with a low error rate.
“This is the key to high-mass-resolution CDMS measurements, and it requires that the charge be measured with a precision that is better than” two-tenths of the charge of an individual electron, says Martin F. Jarrold, a chemistry professor at Indiana University Bloomington and a leader in the field. “The challenge in CDMS now is reducing the time required to make the high-precision charge measurement to below 1 s.”
But analyzing only one or a handful of ions at a time means that conventional CDMS is slow. Each ion can be measured quickly, but many individual ions must be measured to build up a mass spectrum. Some researchers are working on ways to speed up the process.
John Hoyes, who’s behind the one-person operation TrueMass, has designed a CDMS instrument that swaps the linear configuration for a figure-eight path. In that geometry, the ions don’t have to slow down to change direction at the end of a tube.

Credit: Jacob Jordan
Veena Avadhani (seated) and Zachary Miller run the charge detection mass spectrometry instrument in Evan R. Williams’s lab at the University of California, Berkeley.
“The fact that my ions are flying in quite a large volume and always at full speed means that they have less likelihood to interact with each other,” Hoyes says. He can analyze more ions simultaneously than can be done with the linear design.
Hoyes built the TrueMass instrument in partnership with two companies: Fasmatech, a company that makes MS electrospray ionization sources, and Spectroswiss, which specializes in Fourier transform data analysis. The instrument is on its way to Perdita Barran’s lab at the University of Manchester.
“We will make this available to anyone who wants to use it,” Barran says. “That may help other people see whether they want to use it. And it will probably help explore the application space.”
Evan R. Williams, a chemistry professor at the University of California, Berkeley, is working to speed up CDMS analysis. “If this is going to be a practical technique, nobody wants to sit there and acquire data for 20, 30, 40 min,” Williams says. “Our goal is to get this down to the LC [liquid chromatography] timescale.”
Williams wants to analyze as many ions as possible simultaneously. Multiple microfabricated devices in parallel would be one option, but the expensive electronics required for detection make such an approach impractical, he says. “It makes way more sense to pack in the maximum number of ions into the device that you can while still being able to track every single individual ion.” His group’s current instrument can monitor 10–30 ions simultaneously; the team is working to be able to monitor upward of 100 ions at a time.
“We’re decoupling the frequency measurement. People translate frequency to m/z, but that’s assuming a constant energy,” Williams says. He allows ions into the trap with the same m/z but slightly different energies. “The energies don’t have to be very different, because our frequency precision is very good,” Williams says. “Even a tiny change in energy allows us to split out those signals.”
The other type of CDMS is performed on Orbitrap mass spectrometers. The version from the instrument company Thermo Fisher Scientific—direct mass technology (DMT) mode—was developed in collaboration with Neil Kelleher and coworkers at Northwestern University. No hardware changes to the Orbitrap are needed. The main differences are in the number of ions admitted into the trap and how the data are processed. In DMT mode, approximately 800 ions enter the trap at a time. For comparison, 3 million ions are typically let into the Orbitrap at a time for conventional mass spectra.
As in conventional Orbitrap MS, the m/z for each ion is determined by its frequency of motion along a central electrode. In addition, DMT mode sums the induced charge on the Orbitrap’s outer electrode, plotting what Thermo calls selective temporal overview of resonant ions (STORI) data, which track the lifetime of an individual ion. The slope of an ion’s STORI plot is proportional to the charge on that ion.
Other single-molecule mass measurements
Other options for single-molecule mass measurement don’t involve mass spectrometry at all. Instead, they use optical and nanomechanical methods.
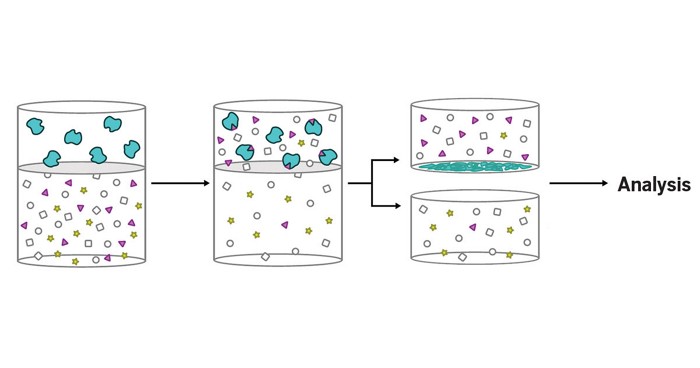
Mass photometry is a microscopy method that was invented by the groups of Benesch and Philipp Kukura at Oxford. “Fundamentally, it’s a light microscope,” Kukura says. “It’s optimized to detect minuscule changes of the reflectivity of a surface.” The surface in question is the interface between glass and water.
When something, such as a protein, binds to the interface, it will scatter light. The microscope’s optics collect the scattered light along with reflected light, and the two interfere on a camera to form an image.
“If you optimize the optical path, you can maximize the phase difference between the scattered and the reflected light,” Kukura says. “Thereby you maximize the contrast using the interference between scattered and reflected light.”
The change in reflectivity is proportional to the mass of the molecule. To be detected by mass photometry, a molecule needs to be at least 30 kDa. To be fully resolved, species must differ in mass by at least 20 kDa. Although a 20 kDa difference is needed to resolve peaks, the instrument can detect mass shifts of as little as 1 kDa.
Mass photometry is not yet ready for measuring mass to the greatest accuracy—the error bars are too wide for that. “Even though the resolution for individual peaks at this stage is nowhere near what you can get in a mass spectrometer, you get just one peak per species. So you gain clarity in your spectrum that compensates for the lower resolution,” Benesch says. “For heterogeneous things, it’s often better to go with the method that gives you fewer peaks in the spectrum, even if they are individually at lower resolution.”
In concept, mass photometry is quite simple; getting it to work—not so much. “If you just go buy or build a microscope and try this, you see nothing,” Kukura says. “This is 15 years of pretty hardcore engineering and research to get these levels of sensitivity.”
NEMS-MS , a nanoelectromechanical method, uses tiny silicon-based resonators to measure the mass of individual molecules. Each resonator, which consists of a beam clamped at both ends, oscillates at a particular frequency. When a molecule, such as a protein, adsorbs to the beam, the oscillation frequency decreases. That frequency change is proportional to the mass of the molecule.
NEMS are particularly well suited for mass measurements of large molecules and assemblies. “NEMS are great because they have an unlimited upper mass range,” says Michael Roukes, a physicist at the California Institute of Technology and a leader in the field. “Any kind of ion optics–based mass spec essentially has a resolving power that decreases with the increasing mass of the species. NEMS are great because the resolving power increases with the analyte mass.”
What’s it good for?
Researchers are turning to single-molecule mass measurements to answer questions that are difficult to answer with other methods.
One application is in gene therapy. Adeno-associated virus (AAV) capsids—the viruses’ protein shells—are used in gene therapy to deliver genetic material to cells. Researchers design the combination of capsid and cargo, so they know what the total mass should be. But the capsids don’t always find their cargo, so researchers don’t know if any given capsid is full, partially full, or empty. Single-molecule mass measurements provide a quick way to answer that question.
Advertisement
One reason that knowing whether capsids are empty or full is important is that AAVs can cause adverse reactions, so empty capsids should be minimized, says Bryan Troxell, formerly head of the analytical development team at the gene therapy firm StrideBio and now at AjaxBio, which provides consulting for preclinical gene therapy programs. Troxell has collaborated with Jarrold’s company, Megadalton Solutions, to analyze AAVs. Troxell would like to use CDMS in combination with cell biology experiments to study how the number of full, partially full, and empty capsids affects cellular response to gene therapy.
Jarrold is using CDMS to study other viruses in addition to AAVs. In the case of norovirus, he has seen unexpected capsid structures. The capsid protein assembles into tiles, which can have various numbers of capsid proteins. Sixty of those tiles form an icosahedron. For example, the T = 3 structure, which has three proteins in each tile, has 180 proteins in the final icosahedron.
Using CDMS, Jarrold and his coworkers have come across an unusual nonicosahedral particle. “It’s made by taking a T = 4 particle, cutting it down the middle, putting a ring of 10 hexagons in there, twisting one of the endcaps by about 18°, and putting it back together,” Jarrold says. “You’ve gone from something that was roughly spherical to something that’s elongated. Under some circumstances, this is the most prominent feature in the spectrum.”
Jarrold and coworkers are using CDMS to see even larger structures, such as a T = 7, with 420 proteins. But they’re having difficulty confirming those structures with cryo-electron microscopy (cryo-EM), a common structural biology method. “There’s no doubt that these are features in the mass spectra. They’re sharp peaks. They’ve got the right masses for particular combinations of hexagons and pentagons, which is what you would expect in viral capsid assembly,” Jarrold says. “But they’re being missed in the cryo-EM measurements.”

Credit: Lohra Miller/Martin Jarrold
The norovirus capsid protein usually assembles into the T = 3 structure, which has 180 copies of the protein. Using charge detection mass spectrometry, Martin F. Jarrold and coworkers found additional, unexpected assemblies, such as the T = 7 structure, which has 420 copies of the protein. They also see capsids with 480, 600, and 700 capsid proteins; they don’t know the structures of those assemblies.
Mass photometry can be used for screening samples before performing other structural biology methods, such as cryo-EM, Kukura says. Researchers can see immediately whether a complex is assembled properly or aggregated into clumps. Without knowing whether a sample is in the expected form, researchers can misinterpret their results or waste time with unusable data. “Here, you immediately see whether you have a homogeneous sample or not,” Kukura says.
Single-molecule mass measurements can also be useful for structures smaller than viruses but whose size or complexity is nonetheless challenging for conventional MS.
“For protein-based therapeutics, we like to look at a molecule at the peptide level, the subunit level, and the intact level,” says Thomas Powers, a senior principal scientist in analytical R&D at the drug company Pfizer. “The challenge we have as things get larger and larger is that conventional mass spectrometers are unable to look at the intact molecule.” In addition, Powers says, CDMS is a valuable tool for characterizing heterogeneous protein therapeutics that have modifications such as attached sugar molecules.
Kelleher and coworkers use Orbitrap-based CDMS to image proteins directly from tissues. For example, they’ve imaged the distribution of proteoforms (distinct versions of a particular protein) in samples of kidney tissue. They’re able to detect proteoforms as large as 100 kDa directly from tissue.
“I think proteoform imaging has a chance to disrupt histology, but we’re a long way from that,” Kelleher says. “We have to prove ourselves with more clinical research.”

Credit: Pei Su/Michael Caldwell/Fatma Butun/Ryan Fellers/Michael Hollas/Northwestern Proteomics
Neil Kelleher and coworkers used Orbitrap-based charge detection mass spectrometry (CDMS) to determine the distribution of proteins directly from human kidney tissue: top, a histological image of kidney tissue stained with hematoxylin and eosin; middle, a CDMS image of glutathione S-transferase A2 (red), transgelin-2 (green), and apolipoprotein A-1 (blue); bottom, a CDMS image of two proteoforms of heat shock protein β-1, one that is acetylated (purple) and one that is both acetylated and phosphorylated (green).
Much of Kelleher’s lab is focused on top-down proteomics, which involves analysis of intact, rather than digested, proteins. In this targeted approach, he takes known disease-related genes and finds as many proteoforms as he can for each gene. The group is mapping all the proteoforms from more than 100 genes.
Kelleher wants to use Orbitrap-based CDMS, which he calls individual-ion MS, as the underpinning for a proteoform equivalent of the Human Genome Project. “I want to do clinical proteoform research so I can continue proving the value of proteoform measurement to understand human biology,” he says. “I aim to unlock a Human Proteoform Project for the benefit of all.”
Kelleher is using Orbitrap-based CDMS to greatly improve throughput, a key bottleneck in single-cell proteomics. To do this, he spreads cells onto a microscope slide and analyzes about 10,000 ions from a cell in a few seconds. From thousands of cells, he can assign about 1,000 proteoforms, not all of which he has been able to identify. He reported the work last week at a single-cell proteomics meeting in Boston.
Albert J. R. Heck’s lab at Utrecht University undertook a head-to-head comparison of Orbitrap-based CDMS and mass photometry for analyzing ribosomes, the large molecular machines that synthesize proteins in cells (iScience 2021, DOI: 10.1016/j.isci.2021.103211). The advantage of mass photometry is that the measurement can be performed in nearly physiological conditions. The advantage of CDMS is that it has better mass resolution. But both methods were able to determine the masses of ribosomal particles within 1% accuracy.
Michael Marty, a mass spectrometrist at the University of Arizona, uses Orbitrap-based CDMS to study complex membrane mimics. He makes nanodisks that consist of two protein belts with a lipid bilayer in the middle. As he put more types of lipids in an individual nanodisk, native MS became less able to resolve the spectra. In his first foray into CDMS, he used natural lipid membranes in the nanodisks and was able to readily measure their masses. Now his team is moving beyond nanodisks to look at species such as low-density and high-density lipoproteins, which are much more complex.
Another application of single-molecule mass measurement is in the food industry. For example, David L. Schroeder, senior principal scientist in analytical R&D at Kraft Heinz, has worked with Megadalton Solutions to use CDMS to analyze complex carbohydrates in food. “Accurate and precise complex carbohydrate analytical tools are important to enable Kraft Heinz to deliver new nutritional benefits with flavor and taste to delight consumers,” Schroeder writes in an email. “Historically, complex carbohydrates were difficult to measure, especially direct mass determination.”
Single-particle mass measurements need not be limited to biological materials. The mass and size of polymeric nanoparticles, for example, can affect their properties. Williams, at UC Berkeley, used CDMS to characterize polystyrene nanoparticles used as calibration standards for transmission electron microscopy (TEM) (ACS Nano 2023, DOI: 10.1021/acsnano.3c00539). The nanoparticles have a narrow size distribution, with a mass of about 360 MDa and a diameter of 100–101 nm. The size distribution measured by CDMS agreed well with the size distribution acquired via TEM.
But the researchers were also able to see characteristics that TEM missed. The nanoparticles sometimes form dimers. Because Williams ionizes the nanoparticles from a dilute solution in tiny solvent droplets, the likelihood of more than one nanoparticle being in a single droplet is about one in a million, he says. “We’re seeing dimers, so those dimers have to have come from solution.”
So far, researchers using single-molecule mass measurements have focused on large molecules and complexes and on heterogeneous mixtures because those are the circumstances in which conventional MS methods fall short. But Heck thinks that there’s reason to consider using the methods for smaller species as well.
“We are forgetting the other advantage—a million times more sensitive detection,” he says. “I don’t think we know yet how to use that optimally.”
Commercial options
For people who want to do single-molecule mass measurements in their own labs, the commercial options remain limited, but more products are on the horizon.
For conventional CDMS, Megadalton Solutions, founded by Jarrold, Benjamin Draper, and David Clemmer, another chemistry professor at Indiana University, offers CDMS as a service. Megadalton decided that it didn’t make sense to try to get into the business of selling instruments, so it worked with Indiana University to license the CDMS intellectual property portfolio to the instrument maker Waters.
“If we were going to make instruments, we would also need to have service people, and setting up a network of service people seemed too large a job for us,” Jarrold says. “We were looking for a partner, and Waters was a natural partner.”
Megadalton, in turn, acquired a license to continue providing CDMS services. Waters is developing a commercial CDMS instrument and hopes to have one ready for beta testing in the next few months, according to Davy Petit, who’s in charge of the biologics portfolio at Waters. The company does not yet know when a commercial product will be ready, he says.
Hoyes’s company, TrueMass, is in a similar situation. The company’s sole instrument is being set up in Barran’s facility at the University of Manchester, where researchers will be able to try it out as beta testers. It’s unclear when TrueMass might have an instrument available for sale.

Credit: Refeyn
Loading a sample onto a mass photometer
Orbitrap-based CDMS is commercially available as Thermo’s DMT mode, which is exclusively available for the Q Exactive ultrahigh mass range instrument. At this point, Thermo doesn’t have specific plans to expand the availability of the DMT mode to other Orbitrap platforms, according to Amanda Lee, a product marketing manager at the firm.
In addition to Thermo’s DMT mode, two open-source computer programs—from Heck’s group and Marty’s group—are available for analyzing Orbitrap CDMS data. The availability of open-source versions “really lowers the barrier of entry for people who want to try this,” Marty says.
Mass photometers are commercially available from Refeyn, a company started by Daniel Cole, Gavin Young, Kukura, and Benesch in 2018. The company has sold more than 250 instruments so far, according to Matthias Langhorst, the company’s chief product officer. Customers are divided roughly equally between academia and industry, he says.
Jarrold thinks CDMS has the potential to completely change MS of complex mixtures. “A spectrum that would be horrendously complicated because you’ve got all these different overlapping m/z charge states now becomes completely solved,” he says. Instead of overlapping charge distributions, each species has a single peak. “If you can measure that single peak with very high resolution, then you can separate it out from all the other peaks. This becomes very enabling.”
Celia Henry Arnaud is a freelance writer based in College Park, Maryland.
Chemical & Engineering News
ISSN 0009-2347
Copyright © 2024 American Chemical Society
You might also like...

The power is now in your (nitrile gloved) hands
Sign up for a free account to get more articles. Or choose the ACS option that’s right for you.
Already have an ACS ID? Log in
Join the conversation
Contact the reporter
Submit a Letter to the Editor for publication
Engage with us on Twitter