Advertisement
Grab your lab coat. Let's get started
Welcome!
Welcome!
Create an account below to get 6 C&EN articles per month, receive newsletters and more - all free.
It seems this is your first time logging in online. Please enter the following information to continue.
As an ACS member you automatically get access to this site. All we need is few more details to create your reading experience.
Not you? Sign in with a different account.
Not you? Sign in with a different account.
ERROR 1
ERROR 1
ERROR 2
ERROR 2
ERROR 2
ERROR 2
ERROR 2
Password and Confirm password must match.
If you have an ACS member number, please enter it here so we can link this account to your membership. (optional)
ERROR 2
ACS values your privacy. By submitting your information, you are gaining access to C&EN and subscribing to our weekly newsletter. We use the information you provide to make your reading experience better, and we will never sell your data to third party members.
Analytical Chemistry
The Sound Of Spectra
Educators convert infrared data into sound files, giving chemists with limited vision a new tool
by Craig Bettenhausen
August 5, 2013
| A version of this story appeared in
Volume 91, Issue 31
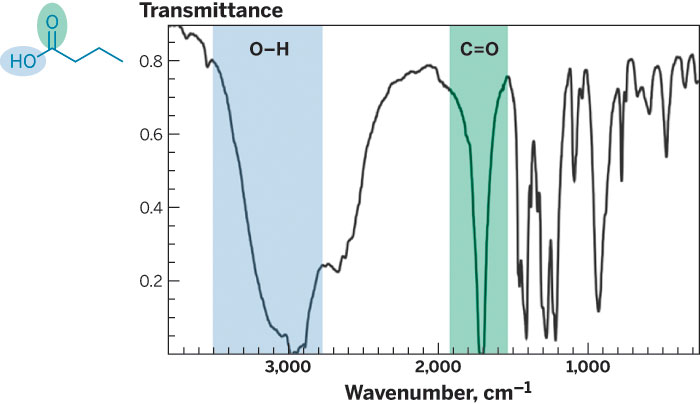


The marimba is rarely called for when analyzing chemical data. But it is the instrument of choice for a team of educators who have adapted infrared spectra into an audio format for use by visually impaired scientists and students (J. Chem. Educ. 2013, DOI: 10.1021/ed4000124). Florbela Pereira, Joao Aires-de-Sousa, and coworkers at the New University of Lisbon used open-source software—available on their MOLInsight project page—to convert IR data to MIDI format, a type of digital music file. The magnitude of the IR peaks, normally the y axis in spectra, is represented by the pitch, with a higher note indicating a stronger signal. The frequency, normally the x axis, is represented by time. After some training, a group of visually impaired students were able to correctly identify the main functional groups represented in sample spectra and use that information to identify organic molecules. The software could be easily extended to other types of spectra. One student, Sérgio Neves, says the approach “allows me to summarize the spectral data into a small audio graphic, providing a more global overview of the spectrum.”
You might also like...


The power is now in your (nitrile gloved) hands
Sign up for a free account to get more articles. Or choose the ACS option that’s right for you.
Already have an ACS ID? Log in
Join the conversation
Contact the reporter
Submit a Letter to the Editor for publication
Engage with us on Twitter